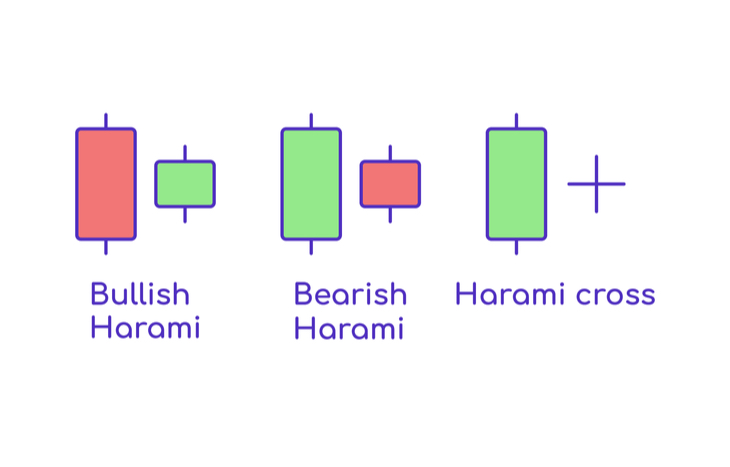
What is a Bullish Harami?

As technical patterns culminate in a breakout, traders look for signals as to which direction the stock price might head. This is especially important in reversal patterns. Signals like a bullish harami let traders know that the momentum of the price trend is slowing. It also lets them know that a reversal is soon to occur.
A bullish harami is one of several bullish reversal patterns. It forms on price downtrend. And, assuming the reversal is true, marks the start of an uptrend in price. It’s a signal traders look for within larger reversal patterns, such as an expanding triangle or a falling wedge. On the surface, a bullish harami might not stand out on a candlestick chart. Yet, it’s an important marker for an impending bullish price change.
Let’s take a look at the bullish harami as a candlestick pattern. We’ll go over how it forms, what it means and what traders can expect after it manifests.

Identifying a Bullish Harami
For those familiar with a bullish engulfing pattern, a bullish harami mirrors it. Instead of a second bullish candle engulfing the preceding smaller bear candle, it’s the opposite. A harami features a large bearish candle that’s followed by a much smaller bullish candle, contained within the bear candle. To qualify as a harami, the pattern must follow a few criteria:
- The open of the bullish candle must be above the previous close of the bearish candle.
- The close of the bullish candle must be below the previous open of the bearish candle.
- The bullish candlestick must fall within the body of the bearish candlestick.
- The length of the “tails” doesn’t matter; only the body matters.
Often, the bullish candle of the pattern will take the form of a doji. It’s a candle with very similar open/close price points. In some cases, the doji might even become a cross, if the open/close prices are equivalent. In Japanese, doji means “mistake,” which is indicative of trader sentiment. Traders aren’t sure how they feel about the price, hence the relativity between open and close, even despite the day’s highs and lows.
The Trading Psychology Behind a Bullish Harami
A harami represents uncertainty. The large black candle represents a strong bearish sentiment in one trading period. However, it’s followed by a distinct, albeit small, bullish push. This signals a struggle between bulls and bears. The bullish response is enough to kickstart a reversal of the price.
The long black bearish candle means bears have pushed the price of a stock down dramatically over a single trading period. As the price gaps up to open bullish, it shows that bulls believe the price is too low. They’re buying because they believe the stock is now undervalued. Yet, there’s uncertainty about the true value of the stock; hence the doji.
Ultimately, if a bull can stabilize the price of the stock within the trading period, there’s a chance to create new support and a bullish push upwards. The harami is the point of reversal, representing the culmination of a greater bullish reversal pattern. It’s a buy signal of bulls and a sell signal for bears.
Other Important Factors to Consider
There are several factors that can inform the strength of the impending bullish reversal following a harami. This signal is most relevant following consecutive periods of downward trading. If the price of a stock has traded sideways, pattern traders will need to scrutinize the signal closely to validate it. Here are a couple of indicators in the strength and validity of a bullish harami:
- The higher the doji within the body of the preceding bearish candle, the more likely bullish sentiment in the trading period to come. Bulls will capitalize on momentum.
- The higher the upward gapping from the previous close to the current open, the stronger the reversal signal is heading into the first bullish period.
- The higher the trading volume on the downtrend, the stronger the reversal signal that comes with the harami.
It’s always best to zoom out from a harami to look at its context within a larger bearish pattern. If there are clear markers for impending reversal, the sudden reversal in investor sentiment becomes validated within the scope of the pattern. Without this context, there’s always the chance a harami could be false.
Bullish vs. Bearish Harami Pattern
As the name implies, a bearish harami pattern is the opposite of a bullish one. It forms on a price uptrend and signals a bearish reversal. A bearish harami looks the same, but features a large bullish candlestick that’s followed by a bearish doji. The price is likely to fall following the manifestation of this pattern at the peak of a bullish trend.
Traders trying to capitalize on a bullish harami will open long positions as the reversal signals uptrend. Conversely, a bearish harami signals an opportunity for shorts to move in. Both types of traders can rely on pattern retracement to set stop-losses and price targets, based on pattern formation.
Harami is Japanese for “Pregnant”
When it appears on a stock chart, a bullish harami looks a little like a pregnant woman: a body with a baby bump. The name is even more apropos when you think about it like a pregnant pause in the downtrend of a stock’s price. The pattern gives birth to a reversal that sends the price climbing once again. No matter the analogy, a harami is a signal any trader needs to be on the lookout for as they monitor a reversal pattern and look for breakout signals.


